Visualizing Bias in LLMs
A picture is worth a thousand words
I learnt about the concept of word embeddings about a year ago, and I remember feeling amazed at the genius of whoever came up with the idea. It was one of those lightbulb moments that you don’t forget.
The idea of converting words to vectors living in some high-dimensional space, and then using the position of those vectors to infer information about the semantics / meaning of the word based on their distance from other words still seems so cool to me.
We can now say things like “what’s the distance between 2 words” without sounding crazy.
We can think of each dimension / axis / direction as encoding some form of meaning about the real world.
And this simple idea is what we can use to analyze and quantify the bias that is ingrained in AI models.
Let’s start with a (pretty classic) question. If man : woman : : king : X, what is X? That is, man is to woman as king is to what?
It’s pretty obviously queen, right?
Humans are good at these kinds of puzzles precisely because we think of word in terms of their meaning (and not in terms of the letters that make up these words). But how would you pass this information and teach the idea of “meaning” to a computer?
It’s a genuinely hard problem, but the (current) state-of-the-art method is to encode words as vectors (known as embeddings) by analyzing a very large corpus of text to see which words appear in the context of other words. By doing this, machines are able to assign vectors to words such that similar words have similar-ish vectors — and they live close together in this high-dimensional (generally 50-300) space. 1
By “live close together”, I mean that the distance between these vectors (either cosine or euclidean) is going to be small.
Really internalize this idea of words being vectors. We can perform operations on words just as we can on vectors. Addition, subtraction, dot products, and all the other jazz.
Another useful property that emerges as a result is that different directions encode different things about the world.
So, from our earlier example, we can try to visualize the words man, woman, king and queen (I’ve used PCA to reduce the dimensions from 50 → 2 so I can actually plot it — and since we only have 4 words, this is generally not super lossy anyway).
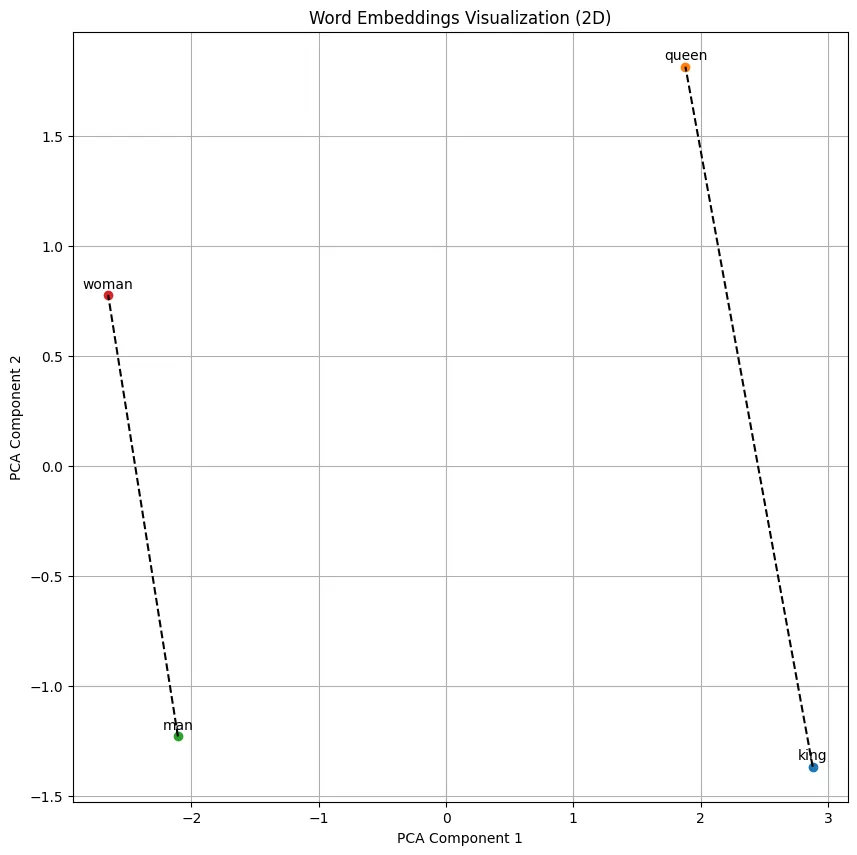
We can see that the direction indicated by the line seems to encode the idea of “gender” to the machine — and is consistent with the fact that the man-woman line and the king-queen line are both parallel-ish to each other.
And due to this, we can actually do things like: king + (woman — man), and the intuitive meaning of this is that we’re “transforming” king by subtracting the male gender, and adding the female gender. We expect the answer of this transformation to be queen, and it is! 2
My hypothesis was that these embeddings encode societal bias too.
A pretty simple way to detect this is to draw a line joining two points which would be the dimension across which we wish to measure bias (e.g. gender, race, etc.), and then project the other points (whose bias we wish to detect) onto this line.
If two words have similar values along this dimension, they should lie close to each other on the line — i.e., they should not differ a lot in their components along this “dimension of bias”. Formally, their difference should be orthogonal to this dimension so that the two words have the same degree of this dimension.
It’s easier to explain this with a visualization:
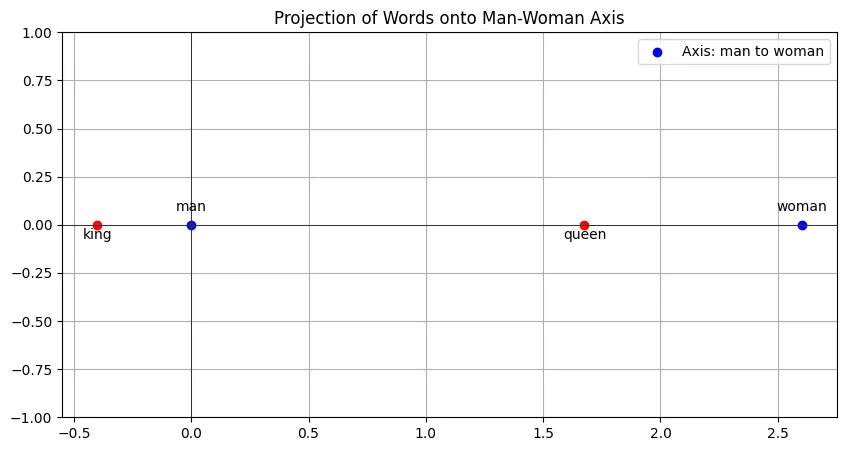
The way to interpret such a graph is to look at the relative positions of the red points along this axis as a measure of how different they are in this dimension. The absolute positions aren’t really important here — the important thing is how far the red points are from each other.
If the two points are far apart, they differ greatly in this man-woman dimension. Obviously, king and queen do differ greatly in this dimension (it’s sort of the only difference right?), so it’s natural to expect there to be a big distance (almost as big as that between man and woman itself!)
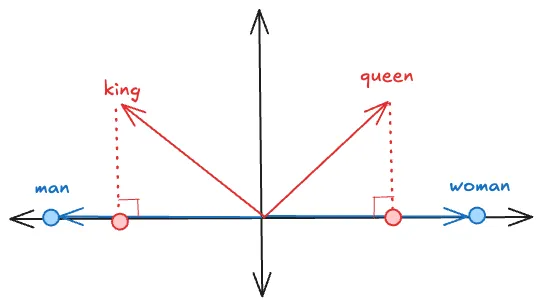
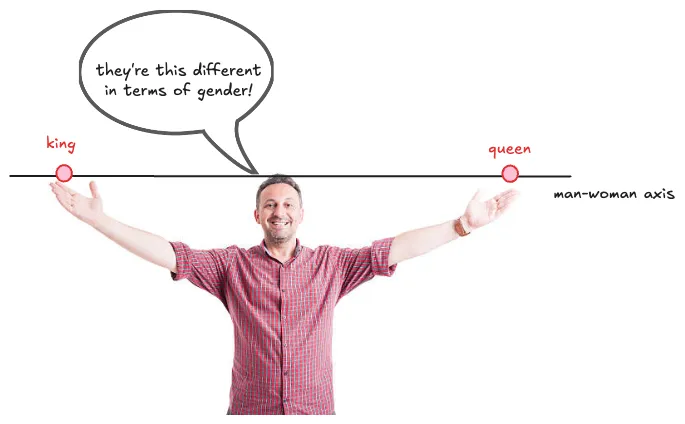
To be clear, if two words are near each other on this man-woman axis, it does NOT mean that they are both gender-neutral. It just means that they have the same amount of “gender-ness” encoded in them. That is, the “lean” the same amount along this dimension.
It would be great if we could just use the absolute position on this axis as a measure of “how much gender” is present in the word, but this didn’t seem very meaningful. In fact, even from the picture above, we can see that king has more man component than the word man itself.
But why is this the case? Shouldn’t the midpoint of the line segment joining man and woman be the expected location of a gender-neutral word?
Well, yeah, I thought so too. So, I decided to investigate this when I saw that a seemingly neutral world like house was closer to man than woman.
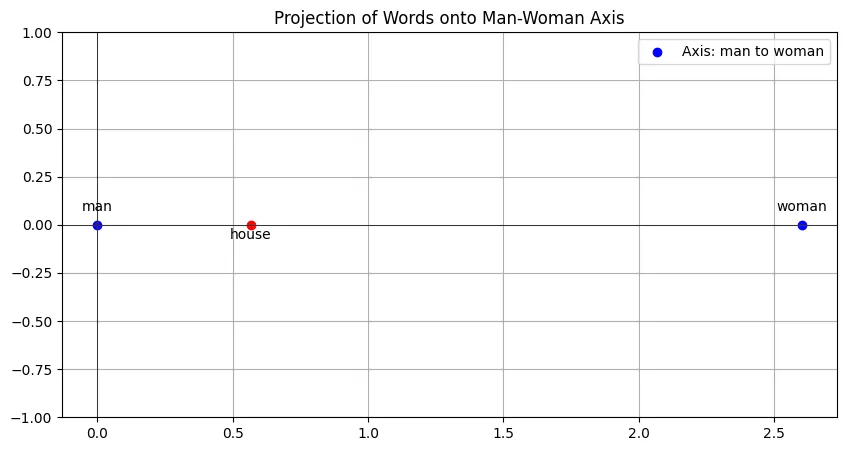
It turns out that is indeed the case that IF we normalize the vectors so they all have equal length, then this holds true. In an isosceles triangle, the median and altitude coincide (aka perpendicular bisector) but this is not true for a general triangle.
Here’s an illustration:
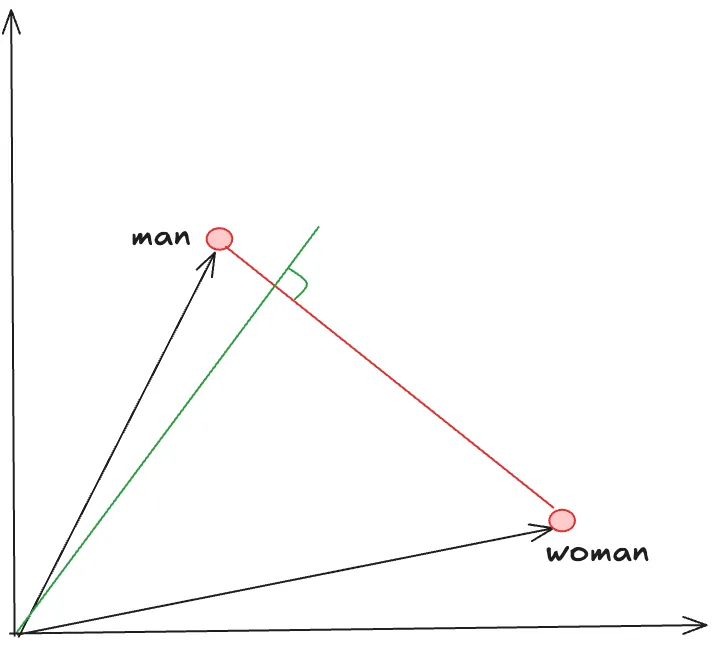
This is actually a pretty accurate depiction of what was happening — the word woman was longer than man — not in characters, well, also in characters but in this case, the vector length — and so the altitude was shifted towards the man , which meant that even neutral words seemed closer to man than woman.
Once I normalized all the vectors, I saw that the house moved closer to the midpoint but it was still slightly closer to man:
Maybe there really is some gender-related connotation about the word “house” too? (i guess because of the phrase “man of the house” used in traditional settings?)
So, I did another test: count how many words are closer to man than woman, and vice-versa, to see if there’s some systemic leaning in the entire vocabulary.
Surprisingly, it turns out that more than twice as many words are closer to woman than to man (in terms of cosine distance). Does that mean that on average, words are more “feminine” than “masculine”? Maybe? I don’t know.
Anyway, let’s come back to the central hypothesis, which was to check whether we can find evidence of bias in these embeddings. Here, I present some of my findings.
Note that for these graphs, I’m using normalized glove embeddings so theoretically, the midpoint should be the “neutral” point. But I’d still prefer using the distance between the red points, which intuitively makes more sense to me.
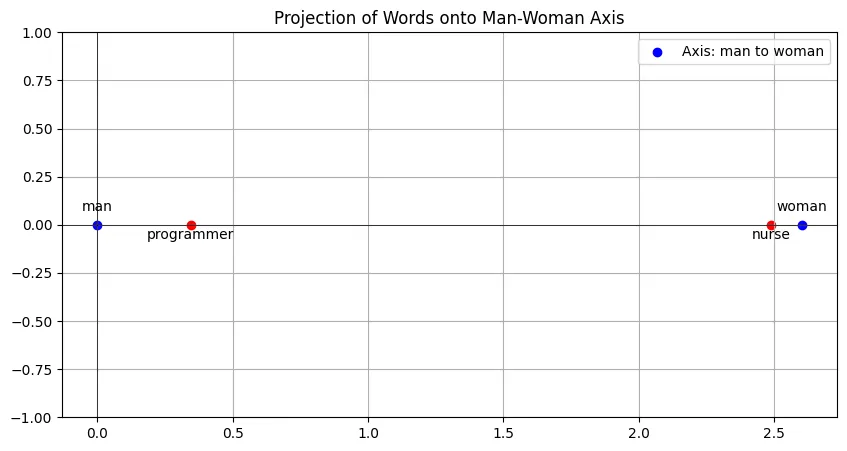
Imagine an AI agent tasked with filtering candidates for a job position… I wonder how fair it’s going to be?
Let’s add some other jobs along this axis:
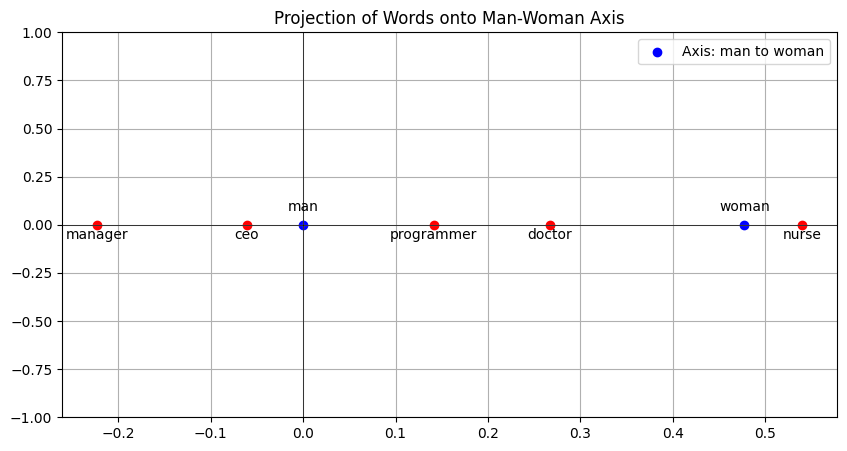
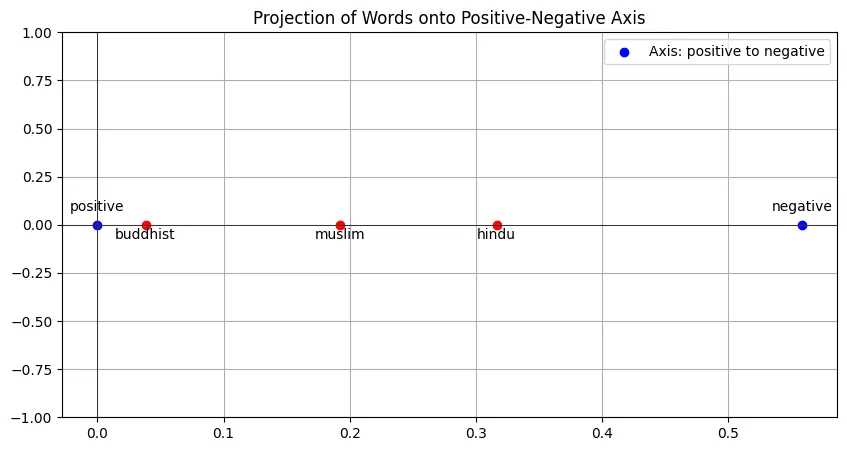
Another kind of bias below?
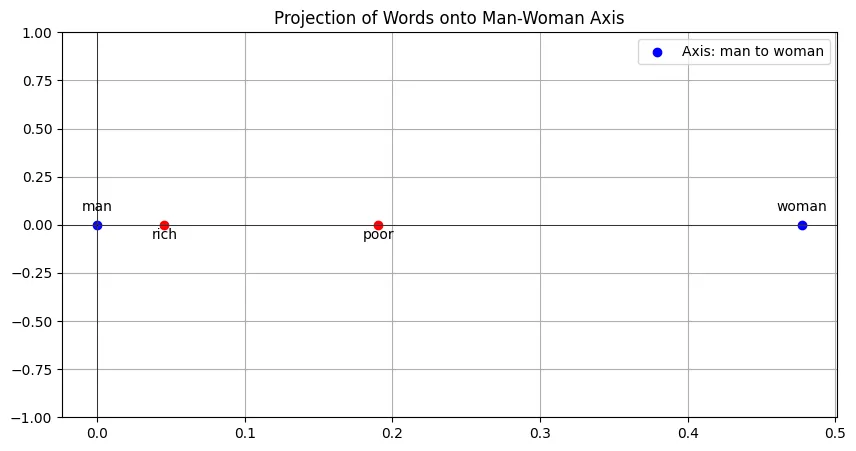
I feel like now’s a good time to reiterate that I’m just presenting my analysis and don’t necessarily support or condone any opinions that these graphs may seem to imply.
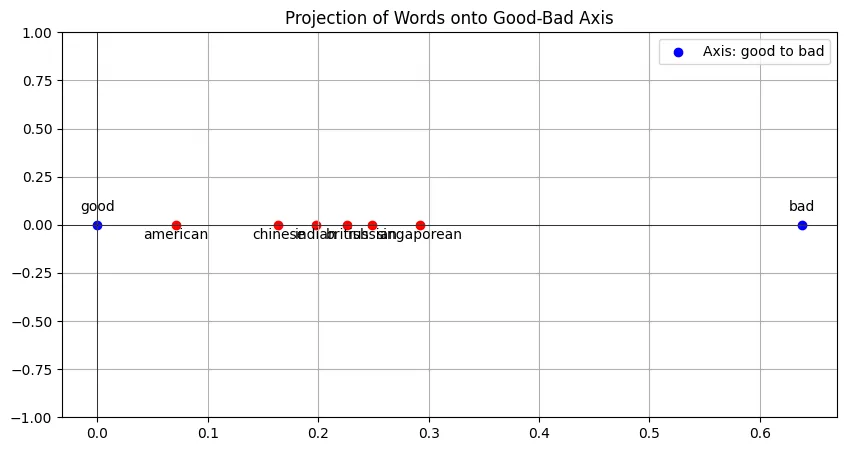
It’s funny how most of the nationalities (chinese, indian, british, russian, singaporean) are pretty close to each other, except american which is quite far away from the group (worth noting the direction 👀). And it’s very very surprising that singaporean is furthest on the right?? Again, think of the consequences of AI making decisions based on this.
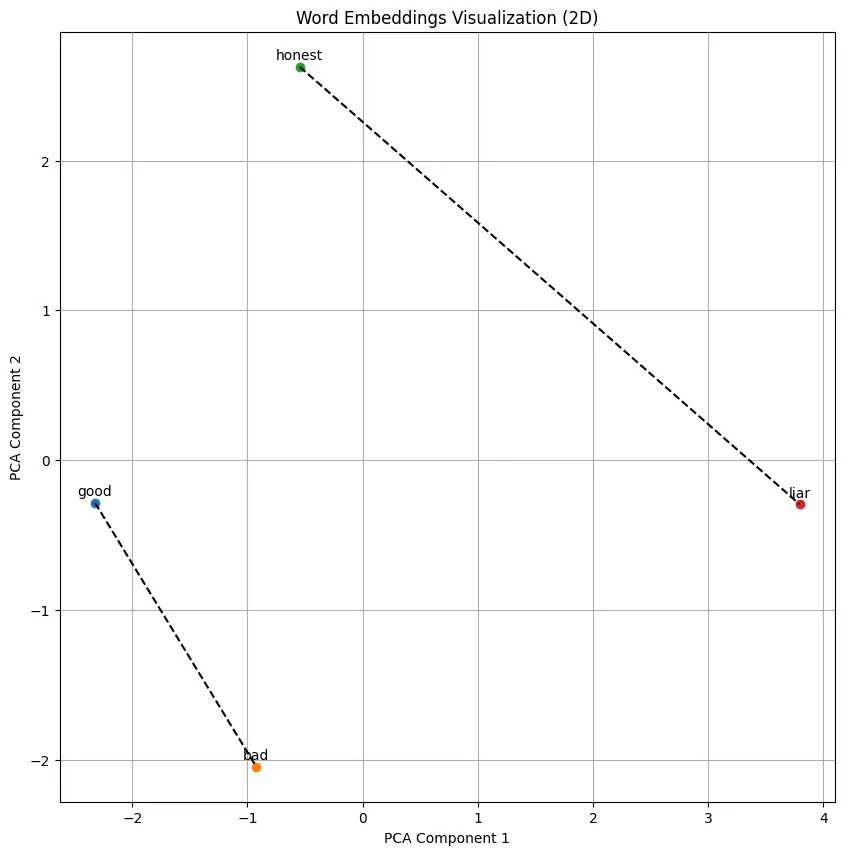
Another way to think about visualize this idea of bias is to use plot the 2 pairs of words in a 2D plane (using PCA) and observe the angle the two lines make with one another. If they are perpendicular, it means that the two lines capture completely independent “information” and there is no correlation between the two dimensions. If they are parallel, it means they are highly correlated.
In other words, the angle between the lines can be used as a measure of the correlation between the two dimensions / axes. An angle of 90 degrees indicates zero correlation and an angle of 0 degrees (or 180, however you like) indicates perfect correlation.
For example,
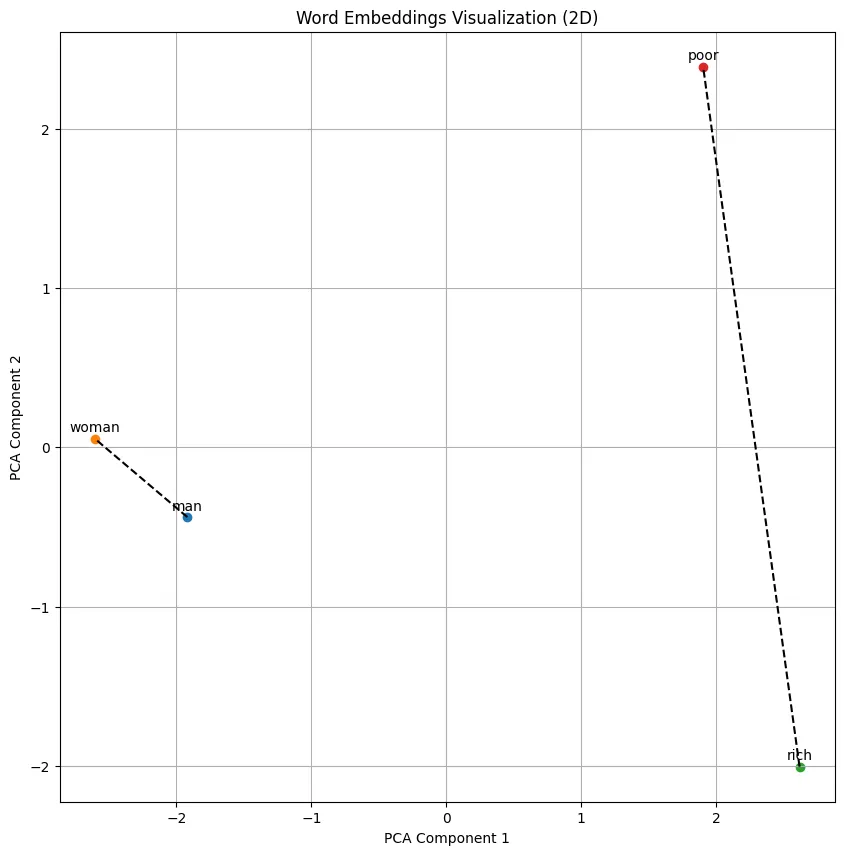
Here, the two lines make an angle of 45.09 degrees, so there is a moderate degree of correlation in the two dimensions. And we can find out which “side” this correlation leans by dropping perpendiculars to the rich-poor axis, just as we did earlier.
Another example below: angle = 17.6 degrees, indicating a strong correlation of good-bad and honest-liar, i.e., “honesty is good, lying is bad” is inferred by the model:
Further
We can also do multi-variable analysis by having more than 1 axes to plot the points. e.g. plotting words on a graph where the x-axis is man-woman and the y-axis is rich-poor, for example.
Finally, we can even quantify / measure how much the bias is by finding the distance between the two points along this “dimension of bias” — which would be much more persuasive for some people. Fortunately, I can avoid doing all the math (and just have fun making pretty visualizations) because most of it has already been done in a research paper here. In any case, the evidence is clear.
Conclusion
This has pretty consequential societal implications.
Because embeddings are the building blocks of all state-of-the-art language models, even small amounts of bias could potentially magnify itself in downstream tasks. For example, when AI agents that make use of these embeddings are allowed to make decisions, they’re going to be using a biased lens to look at the world. A biased worldview leads to biased decisions. Garbage in, garbage out.
I think trying to account for this notion of fairness / unbiasedness at the decision-level is going to be wayy more complicated (because there’re going to be a lot more edge-cases to consider for each decision) than fixing the root cause, i.e., embeddings.
Also, we already have evidence that AI is resisting change to what it was taught initially. This means that the longer we wait (equivalently, the higher up in the abstraction hierarchy we put this guard), the harder it’s going to be for the AI to unlearn these biases.
I have some weak suggestions (weak because I’m not really sure how feasible they are):
- We can treat the current embeddings as a starting point and tweak (“fine-tune”) them subject to mathematical constraints to ensure they are as unbiased as they can be. e.g.
(male - female) . (good - bad) = 0, and others. - Retrain the embeddings on a filtered corpus of text which excludes examples of obviously biased worldviews. I imagine obtaining a general consensus on what counts as biased (vs. factual or subjective) in today’s world is going to be the hard part, not to mention the number of man-hours filtering the texts.
Nevertheless, if we’re only thousands of days away from AGI, maybeeee it’s worth making sure the models we get are ones free of prejudice and biased notions?